
Which Metrics Should Be Tracked After Launching a Mobile App?

After a mobile app is launched, user behavior, active usage, conversions, notification performance, technical metrics, and revenue data should be monitored regularly to guide future product development.
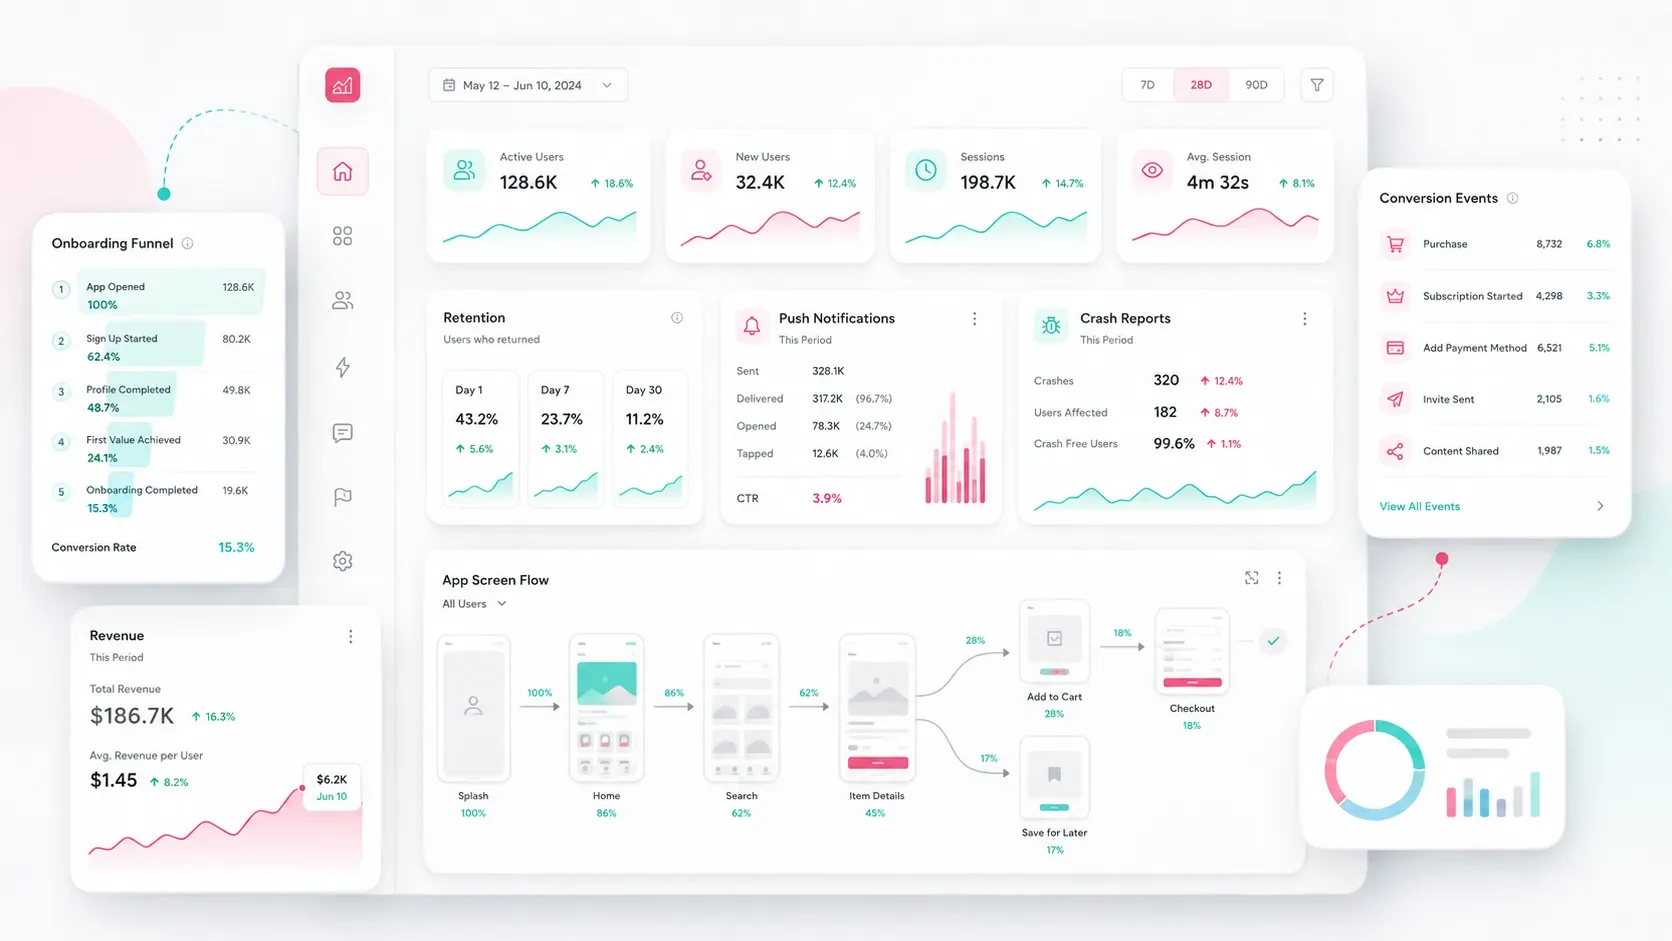
Launching a mobile application is the beginning of its real relationship with users.
Once the app is available, teams can start observing how people actually use the product: where users come from, which screens they visit, which features they use, where they leave a flow, and which actions create the most value.
This information becomes an important part of the product development process.
Instead of making future decisions entirely around assumptions, teams can use real user behavior, technical performance, and business results to decide what should be improved next.
For this reason, analytics, event tracking, error monitoring, notification performance, onboarding metrics, and conversion data should ideally be planned before the application is launched.
When the measurement structure is clear from the beginning, post-launch product decisions become easier to prioritize.
User Acquisition and Traffic Sources
One of the first areas to monitor after launch is where users are coming from.
Acquisition data helps teams understand which channels generate downloads and which marketing activities bring users who continue to engage with the product.
Traffic and acquisition sources may include:
Organic App Store or Google Play searches
Google Ads
Meta advertising
Social media
Website referrals
Email campaigns
QR codes
Referral links
Influencer campaigns
Partnership campaigns
Download numbers alone do not provide enough information.
A campaign may generate a large number of installs while producing very few completed registrations or active users.
Another campaign may bring fewer installs but attract users who register, return regularly, and complete valuable actions.
For this reason, acquisition data should be evaluated together with onboarding, active usage, and conversion metrics.
The goal is to understand not only which channel generates traffic, but also which channel brings valuable users.
Registration, Login, and Onboarding
The first-use experience has a significant influence on whether users continue using an application.
A user may install the app, open it for the first time, review introductory screens, create an account, verify their information, complete their profile, and perform their first meaningful action.
Each of these steps can be measured.
Useful onboarding metrics may include:
First app opens
Registration screen views
Registration starts
Completed registrations
Email or phone verification rate
Successful logins
Password reset requests
Profile completion rate
Completion of the first key action
These metrics help reveal where users experience friction.
For example, if many users reach the registration screen but only a small percentage complete registration, the team can review the number of form fields, verification method, error states, or supporting copy.
If users register successfully but never complete their first meaningful action, the onboarding experience may need to guide them more clearly toward the core value of the product.
For a more detailed look at this flow, you can read our guide on how to plan sign-up and login in a mobile app.
Onboarding data should therefore be treated as more than a technical report.
It provides insight into the user’s first expectations, motivation, and ability to understand the product.
Active Users and Usage Frequency
Downloads tell you how many people installed the application.
Active-user data helps you understand whether they actually continue using it.
Useful usage metrics may include:
Daily active users
Weekly active users
Monthly active users
Number of sessions
Session duration
Average usage per user
Return rate after first use
Retention over specific periods
These metrics provide a clearer view of the app’s ongoing value.
An application may have a high number of downloads but limited repeat usage.
In that case, the team may need to review the product experience, content strategy, notification structure, onboarding, or core value proposition.
Usage frequency should always be interpreted according to the type of product.
A news or content application may naturally aim for daily engagement.
A reservation app may only need to be used weekly or monthly.
A B2B field application may be used according to specific operational workflows.
For this reason, there is no single ideal active-user frequency for every product.
The right benchmark depends on how the application creates value.
Screen Usage and Feature Performance
After launch, teams should understand which parts of the application users actually interact with.
This helps reveal whether product priorities match real user behavior.
Useful screen and feature metrics may include:
Most visited screens
Least visited screens
Navigation between screens
Feature usage
Search usage
Filter usage
Adding to favorites
Adding to cart
Creating an appointment
Form submissions
Content views
File downloads
Sharing actions
The most important events depend on the product.
In an education application, lesson views, completion rates, and repeat learning sessions may be important.
In an e-commerce application, product views, add-to-cart actions, checkout starts, and purchases become more relevant.
In a customer portal, document downloads, support requests, and notification views may provide more useful signals.
These metrics help teams identify features that users value most.
Frequently used areas can be improved further, while features with very limited usage can be reviewed, simplified, repositioned, or removed.
Future releases can then be shaped around real product behavior.
Conversions and Business Goals
Mobile analytics should also measure whether the application supports its business objectives.
Every product should therefore define its primary conversion events.
Depending on the application, conversion events may include:
Completing registration
Completing a profile
Booking an appointment
Creating an order
Adding a product to cart
Completing a purchase
Starting a subscription
Submitting a quote request
Completing a form
Uploading a document
Creating a support request
Completing content
Upgrading a plan
The most important conversion depends on the product model.
For a healthcare application, booking an appointment may be the primary goal.
For a SaaS mobile product, starting a subscription or upgrading a plan may be more important.
For a dealer application, orders, quote requests, and catalog usage may provide stronger business signals.
Conversion data creates a shared measurement layer across product, marketing, and sales teams.
It helps answer questions such as:
Which users are most likely to convert?
Which screens are closest to conversion?
Where do users leave important flows?
Which acquisition sources generate the strongest business results?
Which parts of the product should be improved first?
Notification Performance and Return Behavior
Push notifications can help bring users back into a mobile application.
However, sending more notifications does not automatically create better engagement.
Teams should measure what happens after each notification.
Useful notification metrics include:
Number of notifications sent
Number of notifications opened
Notification click-through rate
App opens after a notification
Conversions after a notification
Notification permission rate
Notification opt-out rate
Performance by user segment
The meaning of these metrics varies by product.
In an e-commerce application, a campaign notification can be evaluated by tracking product views and purchases that follow it.
In a reservation application, reminder notifications can be measured against appointment attendance.
In an education app, teams can evaluate whether new-content notifications lead users back to lessons.
Notification performance should therefore be connected with in-app behavior.
The number of messages sent is less important than whether those messages create useful engagement.
A well-planned notification strategy can support user retention without creating unnecessary noise.
Technical Performance and Error Monitoring
Product analytics should be combined with technical monitoring.
Users may understand the product and want to complete an action, but technical issues can still interrupt their experience.
Important technical metrics may include:
App startup time
Screen loading time
API response times
Application errors
Crash reports
Device-specific issues
Operating system-specific issues
Network errors
Login failures
Payment errors
Form submission errors
Performance by application version
Mobile environments vary significantly.
An issue may appear only on a particular operating system version, device model, screen size, or network condition.
Detailed error logs help development teams identify these patterns more quickly.
They can answer questions such as:
Which version introduced the issue?
Which device group is affected?
Which API request failed?
Which user flow was interrupted?
How frequently does the error occur?
For a deeper look at the infrastructure supporting these processes, you can read our guide on why a mobile app needs a backend.
Technical monitoring supports both reliability and long-term product sustainability.
When issues affecting the user experience are detected early, teams can prioritize fixes before they affect a larger group of users.
Revenue, Subscriptions, and Customer Value
For applications with a commercial model, financial metrics should also be part of post-launch measurement.
Depending on the product, relevant metrics may include:
Total revenue
Number of purchases
New subscriptions
Subscription renewals
Subscription cancellations
Plan upgrades
Average order value
Revenue per user
Payment failures
Revenue by campaign
Revenue by customer segment
These metrics are especially useful for subscription, education, fitness, content, SaaS, e-commerce, and service-booking applications.
They help teams understand which customer groups create more value, which plans perform better, and which parts of the product contribute most directly to revenue.
Revenue data can also support product decisions.
For example, teams can analyze:
When free users become paying users
Which features contribute to plan upgrades
Which plans have stronger renewal rates
Where subscription cancellations increase
Which acquisition channels bring higher-value customers
Which campaigns generate sustainable revenue
Financial data therefore serves more than accounting and reporting purposes.
It also helps shape the product roadmap.
Metrics Should Be Evaluated Together
Individual metrics can easily be misleading when viewed in isolation.
A high number of downloads may look positive, but it means less if registration completion is low.
A high registration rate may still create limited value if users never return.
Strong notification open rates may not matter if notifications do not lead to meaningful actions.
Revenue growth may also need to be evaluated alongside acquisition cost, retention, renewals, and cancellations.
The product team should therefore connect different stages of the user journey.
For example:
Acquisition → Install → Registration → First Key Action → Active Usage → Conversion → Retention → Revenue
This creates a more complete view of how the application performs.
Instead of optimizing one isolated number, teams can understand how changes in one part of the experience influence the rest of the product.
Build Dashboards Around Product Decisions
Analytics tools can produce a large amount of data.
A useful reporting structure should prioritize the metrics that actually support decisions.
A product dashboard might include:
New users
Active users
Registration conversion rate
Retention
Primary conversion rate
Most-used features
Crash rate
Notification performance
Revenue
Subscription changes
Different teams may also need different dashboards.
Marketing teams may focus on acquisition and campaign performance.
Product teams may focus on feature adoption, retention, and conversion.
Technical teams may monitor crashes, errors, performance, and API response times.
Management may need a higher-level view combining growth, engagement, conversions, and revenue.
The purpose of reporting is not to display as many metrics as possible.
It is to make important changes and opportunities easier to identify.
Use Post-Launch Data to Shape the Product Roadmap
The strongest value of analytics appears when it influences future development.
After launch, teams begin to receive information that was impossible to fully predict during the planning stage.
Real users reveal:
Which workflows feel natural
Which screens cause friction
Which features create the most value
Which features receive limited usage
Which user groups behave differently
Where technical problems occur
Which acquisition channels perform best
Which actions contribute to revenue
This information can guide the roadmap.
A frequently used feature may deserve additional investment.
A high-drop-off flow may need UX improvements.
A technical issue affecting a specific device group may become a priority.
A marketing channel producing highly engaged users may receive additional budget.
A feature with almost no usage may be simplified or removed.
Product development then becomes an ongoing process informed by measurable user behavior.
Codezone’s Approach
At Codezone, we treat post-launch measurement as a core part of mobile application planning.
We define which events should be tracked, which user journeys need to be measured, and which data will support future product decisions before the application is released.
We begin by evaluating the application’s business goals, user roles, primary conversion points, technical infrastructure, and admin requirements.
From there, we structure the mobile interface, backend, analytics events, notification flows, and error monitoring as connected parts of the same product.
This approach allows the application to evolve through real user behavior and gives teams a clearer foundation for making post-launch decisions.
Conclusion
After a mobile application is launched, acquisition, onboarding, active usage, screen and feature performance, conversions, notifications, technical metrics, and revenue should be monitored regularly.
These metrics show how people actually interact with the product.
They help teams understand which features create value, which workflows need improvement, where technical issues occur, and how effectively the application supports business goals.
A well-planned measurement structure turns analytics into part of the product development process.
The application can then continue evolving around real user behavior instead of remaining a product that was simply released to the store.
Frequently Asked Questions
Which metrics should be tracked after launching a mobile app?
User acquisition, registration completion, active users, feature usage, conversions, notification performance, technical errors, application performance, and revenue metrics can all be tracked depending on the product.
Why are active users more important than downloads alone?
Downloads show how many people installed the application, while active-user metrics show whether people continue to use it. Repeat usage provides a stronger signal of whether the product is creating ongoing value.
How should conversion events be defined in a mobile app?
Conversion events should reflect the application’s business goals. Examples may include booking an appointment, placing an order, starting a subscription, submitting a form, completing content, or requesting a quote.
How can push notification performance be measured?
Notification performance can be evaluated through sent notifications, open rate, click-through rate, app opens after notifications, conversions after notifications, permission rate, and opt-out rate.
Why is error monitoring important after launch?
Error monitoring helps teams identify crashes, login failures, payment issues, API problems, form errors, and device-specific technical issues early. This information supports a more reliable user experience and helps teams prioritize technical improvements.